The 24/7 Work Culture’s Toll on Families and Gender Equality

The biggest obstacle to women in joining the highest ranks of the business world is a lack of family-friendly policies. That, at least, has been the conventional wisdom in recent years, and it has been embraced by progressive companies that offer flexible schedules or allow people to work from home.

But some researchers are now arguing that the real problem is not the lack of family-friendly policies for mothers, but the surge in hours worked by both women and men. And companies are not likely to want to adopt the obvious solution.

The pressure of a round-the-clock work culture — in which people are expected to answer emails at 11 p.m. and take cellphone calls on Sunday morning — is particularly acute in highly skilled, highly paid professional services jobs like law, finance, consulting and accounting.

Offering family-friendly policies is too narrow a solution to the problem, recent research argues, and can have unintended consequences. When women cut back at work to cope with long hours, they end up stunting their careers. And men aren’t necessarily happy to be expected to work extreme hours, either.

Photo

Erin Reid, left, an assistant professor at Boston University, and Robin Ely, a professor at Harvard Business School. “These 24/7 work cultures lock gender inequality in place,” Ms. Ely said. CreditErik Jacobs for The New York Times

“These 24/7 work cultures lock gender inequality in place, because the work-family balance problem is recognized as primarily a woman’s problem,” said Robin Ely, a professor at Harvard Business School who was a co-author of a recent study on the topic. “The very well-intentioned answer is to give women benefits, but it actually derails women’s careers. The culture of overwork affects everybody.”

(more…)

The Public Pension Funding Trap

To make up for shortfalls in contributions, plans take extraordinary risks to earn higher returns.

By ANDREW G. BIGGS

May 31, 2015 5:56 p.m. ET

54 COMMENTS

State and local government pensions were national news during the recession, as unfunded liabilities rose into the trillions of dollars and overheated commentators predicted that rising pension costs could push governments into bankruptcy. Today attention has faded and the public-pension industry claims that plans are back on track. Don’t be too sure.

Governments are still failing to make their full contributions; as recently as this week New Jersey’s chief budget analyst deemed it not “fiscally or physically possible” for the state to make its nearly $3 billion full pension contribution this year. Public pensions are taking greater investment risk with the money they do receive. If those investments fail to pan out, the budget picture for many governments will once again be grim.


Thanks to rising stock markets, the average pension funding ratio, which compares a plan’s assets to its benefit liabilities, rose to 76% from 72% in 2014, according to the Public Plans Database. This led the National Conference on Public Employee Retirement Systems to crow in December that “the vast majority of public pensions are well funded and are growing stronger as the economy continues to recover.” More recently the National Association of State Retirement Administrators statedthat “most states have made a reasonably good effort” to fund their plans. The “perception that many plans and states have failed” is wrong; funding problems persist, Nasra said, in “only a handful of states.”

WSJ

(more…)

U.S. Gets “Big F” on Health Report Card

By Dr. Mercola

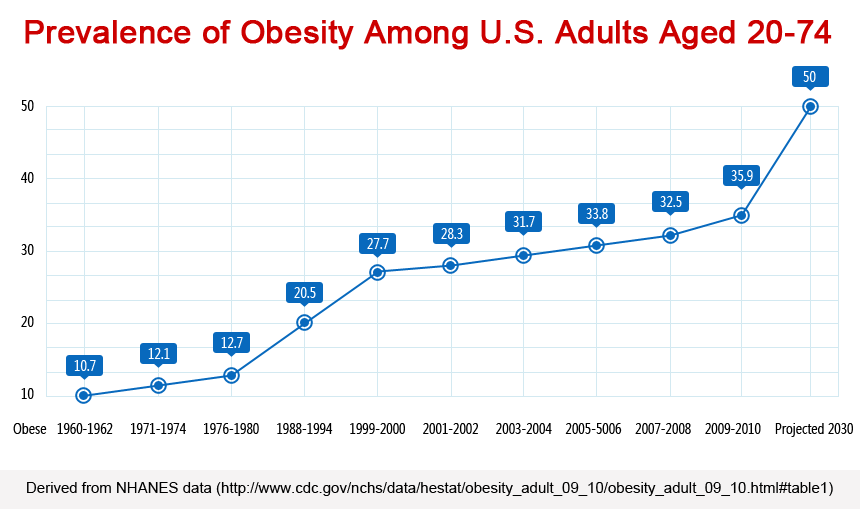
In a health report card published in September, titled “F as in Fat,” the Robert Wood Johnson Foundation and the Trust for America’s Health1 predict that half of all American adults will be obese by 2030.

The report also predicts obesity-related illness will raise national health care costs by $48 billion annually over the next two decades by adding another 7.9 million new cases of diabetes, 5 million cases of chronic heart disease and stroke, and 400,000 cancer cases – all courtesy of Americans’ ever-expanding waistlines.

That prediction is only slightly more dire than the American Journal of Preventive Medicine‘s projection that 42 percent of all adults will be obese by then.2 According to the authors,

“If obesity were to remain at 2010 levels, the combined savings in medical expenditures over the next two decades would be $549.5 billion.”

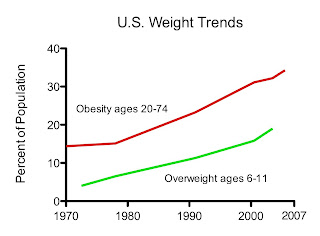
Weight gain since 1970

That’s no chump change, especially in light of the current struggles to keep Medicaid going, and the fact that medical expenses not covered by health insurance is one of the top reasons for personal bankruptcy in the US. Most families are already only one bad diagnosis away from a financial catastrophe and many are at risk of abject ruin should their health fail.

To me this is yet another compelling argument to stay as healthy as you can by following the recommendations on this site, many of which cost next to nothing. All you need to do is give your body the raw materials like healthy unprocessed food, sleep, exercise, appropriate amounts of sunshine to optimize your vitamin D levels, love, emotional balancing and staying away from toxins and poisons and you probably won’t need to set foot in a doctor’s office or hospital, outside of an unfortunate accident.

(more…)

U.S. Weight, Lifestyle and Diet Trends, 1970- 2007

For this post, I compiled statistics on U.S. weight, health and lifestyle trends, and graphed them as consistently as possible. They span the period from 1970 to 2007, during which the obesity rate doubled. The data come from the National Health and Nutrition Examination Survey (NHANES), the Behavioral Risk Factor Surveillance System (BRFSS), and the U.S. Department of Agriculture (USDA). Some of the graphs are incomplete, either because the data don’t exist, or because I wasn’t able to find them.

Obesity is defined as a body mass index (BMI) of 30+; overweight is a BMI of 25+. Yes, it’s frightening. It has affected adults and children (NHANES).

The percentage of Americans who report exercising in their spare time has actually increased since 1988 (BRFSS).

(more…)

The chicken market is so hot right now. Why can’t I trade on it?

By Lydia DePillis January 10, 2014
You might not have noticed yet, but there’s a calamity underway in the beef market: Cattle futures have reached record highs, driven by smaller herds that have been winnowed by years of drought.


That’s some pricey beef! (Barchart.com)

Over time, that will make beef more expensive on the shelf. But at least in the shorter term, the retailers that sell a lot of it — big fast-food companies, for example — are able to hedge their risk by buying futures contracts, which lock in the price for a certain amount of time. That at least allows them to plan for the supply problem by factoring price increases into their menus.

The same isn’t true, however, of poultry. Americans have been eating more and more of the birds in recent decades, but there is no futures market for this increasingly valuable commodity — which saddens commodity traders who see consumers opting for chicken as beef prices rise.

“If I could be ‘long’ chickens right now, that would be the trade of a lifetime,” trader Dan Norcini of Coeur D’Alene, Idaho told The Wall Street Journal.


That’s a lot of fried chicken. (Pew Environment)

Too bad for him! But so wait: Why is there a futures market for beef, but not for chicken?

Well, there used to be. Different commodities exchanges have tried three times to cash in on the growing demand for poultry, first with the Chicago Board of Trade in the 1960s, again in the 1980s and 1990s with the Chicago Mercantile Exchange. Each attempt has failed, for reasons that tell us a lot about how agribusiness works.

(more…)

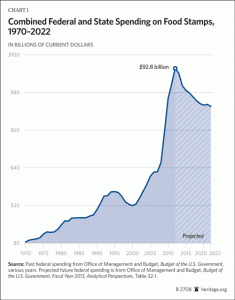
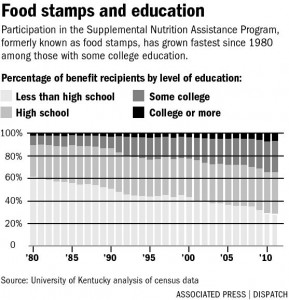
Food Stamps

Bfoodstampreform2012chart1food-stamps-0127-art-g64qqmel-10127gfx-food-stamps-chart-eps


(more…)

Dollar’s Rise Papers Over Miners’ Woes

By 

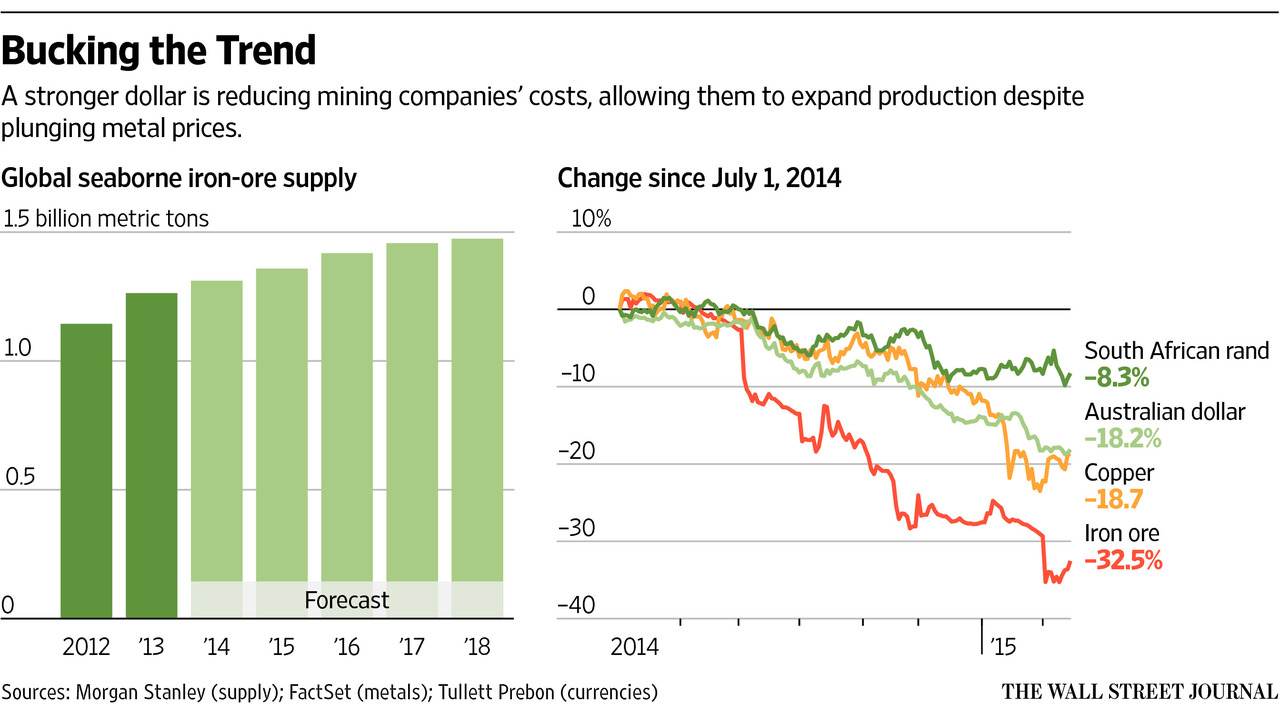
Mining companies, slammed by tumbling commodities prices, have in recent days vowed not to cut production, saying the stronger dollar is cushioning the blow of falling markets.

Companies ranging from Australian miners BHP Billiton and Rio Tinto to smaller firms like South Africa’s Lonmin PLC are benefiting from the stronger greenback because they receive dollars for the gold, copper and iron ore they dig up, but pay for labor and many other costs using local currencies. When the dollar rallies, revenue generated by metals sales stretch further in covering expenses.

MI-CH828_MINING_16U_20150216170309

The dollar’s rise is reverberating across the global economy, dividing the corporate world into winners and losers along geographic lines and reshaping the next phase of commodities prices. The greenback rose against virtually all currencies in 2014 and is off to a roaring start this year, as some central banks around the world, reaching for new ways to boost sluggish economic growth, take steps to devalue their currencies.

(more…)

On work hours in the US and Europe

It is no secret that Americans work more than Europeans – 30% more according to recent studies. Many economists point to higher taxes in Europe as a major cause. This column suggests that divorce rates also play a role, particularly for women’s labour supply.

 According to recent research, Americans work 30% more than Europeans (Prescott 2004 and Rogerson 2006). This was not the case in early 1970s when Western Europeans worked more than Americans. What accounts for the large differences between countries today? Our study finds that divorce rates and tax rates together on average explain 58% of the difference in terms of hours worked between the US and 17 European countries.

Our research starts by trying to uncover the determinants of cross-country differences in work hours through analysing the hours worked by different demographic subgroups (Chakraborty et al. 2012). We find that women are typically the largest contributors to the aggregate differences. European women work less than American women, irrespective of whether we look at single or married women, or women with and without children.

Cross-country variation in tax systems is one of the most popular proposed explanations for the observed discrepancy in work hours between the US and Europe. The basic intuition here is straightforward – higher labour income taxes reduce the incentives to work. However, for the 18 countries in our sample, we find that, while there is indeed a negative correlation between various measures of taxation and hours worked by men, the corresponding correlation for women is close to 0. Figure 1 below plots the correlation between male and female labour supply and the “average effective tax rate”, a measure that combines the average labour income tax and consumption tax in each country into a single tax rate.

Figure 1. Tax rates and labour supply by gender

At the same time, Figure 2 shows that we get the opposite result when looking at the relationship between divorce rates and work hours – we find a strong positive correlation between divorce rates and hours worked by women, whereas male hours and divorce rates are completely unrelated.

Figure 2. Divorce rate and labour supply by gender

While Figure 2 shows that female labour supply is correlated with divorce rates in a statistical sense, it does not answer the key question: Why would the likelihood of divorce affect the decision of females to work?

We believe this is because marriage provides an implicit social insurance since the spouses are able to share their income. However, if divorce rates are higher in a society, women have a higher incentive to obtain work experience in case they find themselves alone in the future. The reason the incentive is higher is because in our data, women happen to be the second earner in the household more often than men. European women anticipate not getting divorced as often and hence find less reason to insure themselves by working as much as American women.

(more…)

A classroom revolution

A classroom revolution

The Conservatives’ plans to change Britain’s deeply flawed education system may be the most interesting idea in this election

THE general election due in Britain on May 6th is not the one David Cameron was chosen to fight. The opposition Conservatives made him their leader in 2005 after a barnstorming speech delivered without notes to their annual conference. His pitch: that he could persuade the electorate to trust him with public services and offer tax cuts too, by “sharing the proceeds of growth”. It was a formula worthy of an earlier young, centrist, opposition politician: Tony Blair, who in 1997 led Labour to victory after 18 years of Conservative rule.

(more…)

Work Smart, Work Hard but don’t work Long!!!

 Get a life

BERTRAND RUSSELL, the English philosopher, was not a fan of work. In his 1932 essay, “In Praise of Idleness”, he reckoned that if society were better managed the average person would only need to work four hours a day. Such a small working day would “entitle a man to the necessities and elementary comforts of life.” The rest of the day could be devoted to the pursuit of science, painting and writing.

Russell thought that technological advancement could free people from toil. John Maynard Keynes mooted a similar idea in a 1930 essay, “Economic possibilities for our grandchildren”, in which he reckoned people might need work no more than 15 hours per week by 2030. But over 80 years after these speculations people seem to be working harder than ever. The Financial Times reports today that Workaholics Anonymous groups are taking off. Over the summer Bank of America faced intense criticism after a Stakhanovite intern died.

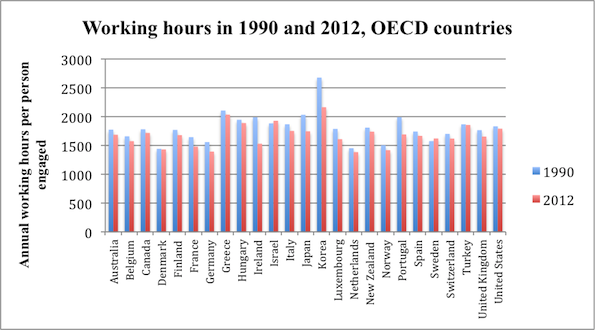
But data from the OECD, a club of rich countries, tell a more positive story. For the countries for which data are available the vast majority of people work fewer hours than they did in 1990:

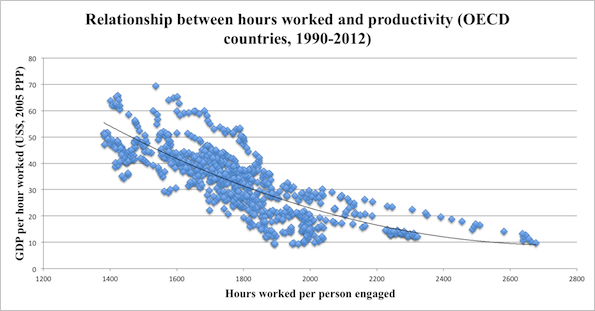
And it seems that more productive—and, consequently, better-paid—workers put in less time at the office. The graph below shows the relationship between productivity (GDP per hour worked) and annual working hours:

The Greeks are some of the most hardworking in the OECD, putting in over 2,000 hours a year on average. Germans, on the other hand, are comparative slackers, working about 1,400 hours each year. But German productivity is about 70% higher.

(more…)

Statistics Don’t Lie, People Do!

Pay Equity & Discrimination 

Women are almost half of the workforce. They are the equal, if not main, breadwinner in four out of ten families. They receive more college and graduate degrees than men. Yet, on average, women continue to earn considerably less than men. In 2013, female full-time workers made only 78 cents for every dollar earned by men, a gender wage gap of 22 percent. Women, on average, earn less than men in virtually every single occupation for which there is sufficient earnings data for both men and women to calculate an earnings ratio.

In 2013, female full-time workers made only 78 cents for every dollar earned by men, a gender wage gap of 22 percent.

IWPR tracks the gender wage gap over time in a series of fact sheets updated twice per year. According to our research, if change continues at the same slow pace as it has done for the past fifty years, it will take 44 years—or until 2058—for women to finally reach pay parity. IWPR’s annual fact sheet on the gender wage gap by occupation shows that women earn less than men in almost any occupation. IWPR’s Status of Women in the States project tracks the gender wage gap across states. IWPR’s report on sex and race discrimination in the workplace shows that outright discrimination in pay, hiring, or promotions continues to be a significant feature of working life.

(more…)

Statistics Don’t Lie, People Do!


Scholastic Assessment or g?

The relationship between the Scholastic Assessment Test and general cognitive ability.

Abstract

There is little evidence showing the relationship between the Scholastic Assessment Test (SAT) and g (general intelligence). This research established the relationship between SAT and g, as well as the appropriateness of the SAT as a measure of g, and examined the SAT as a premorbid measure of intelligence. In Study 1, we used the National Longitudinal Survey of Youth 1979. Measures of g were extracted from the Armed Services Vocational Aptitude Battery and correlated with SAT scores of 917 participants. The resulting correlation was.82 (.86 corrected for nonlinearity). Study 2 investigated the correlation between revised and recentered SAT scores and scores on the Raven’s Advanced Progressive Matrices among 104 undergraduates. The resulting correlation was.483 (.72 corrected for restricted range). These studies indicate that the SAT is mainly a test of g. We provide equations for converting SAT scores to estimated IQs; such conversion could be useful for estimating premorbid IQ or conducting individual difference research with college students. 

To continue reading the full text, please click on the link  The Relationship Between the Scholastic Assessment Test and General Cognitive Ability

Source: SAGE Journal 

Schooling, Intelligence, and Income

Abstract

In this article, the authors examined the evidence for linkages among 3 variables: schooling, intelligence, and income. They concluded that intelligence and schooling have a bidirectional relationship, with each variable influencing variations in the other. Moreover, changes in both schooling and intelligence influence variations in economic outcomes. Although any single study of the interdependency of these 3 variables can be criticized on the grounds that the data are correlational–and consequently are open to alternative interpretations—when viewed together, the evidence for their linked causality is quite convincing: Each increment in school attendance appears to convey significant increases not only in economic and social returns but also in psychometric intelligence. Thus, the value of schooling appears to extend beyond simply schooling’s direct effect on income.

To continue to read the full text, please click on the link  Schooling, Intelligence, and Income

Source: American Psychologist, Vol 52(10), Oct, 1997. Special Issue: Intelligence and Lifelong Learning. pp. 1051-1058.

SAT

A Good Night’s Sleep is the Secret to Success

Tossing and turning the night before a big presentation at work, or going without sleep for reasons you just can’t explain — there’s little doubt that failure to get a good night’s sleep leaves you groggy and dazed, at best. But the cognitive effects of sleep deprivation, whether you miss an entire night or just an hour each evening, could cost you in ways you never imagined.

Evidence from University of California–San Diego researchers suggests sleep times are directly linked to earnings. Their findings, currently under review, found that sleeping one extra hour each night increased average earnings by 16 percent. For their average study participant, this meant an extra $6,000 per year.

“The worst bout of insomnia I’ve had in my life, I went five nights without sleeping,” recalls 36-year-old Amanda McCauley of Omaha, Nebraska. “I was on a business trip, so I had to work the entire time. I had to be up, moving around, engaging and productive pretty early in the morning, and pull a few late nights.”

McCauley, who works in IT, says she hasn’t seen the long-term effects of her sleepless nights, but knows her insomnia has definite mental effects, which, in turn, affect her at work.

“I have to try and keep busy [on those days], because if I don’t keep busy, that’s when I start to suffer,” she says.

Sleep and Your Mind

The cognitive skills we depend on in our professional lives are affected when we fail to get good sleep. Our abilities to focus and concentrate, reason, remember and make good judgment calls all suffer. Emerging research suggests our brains depend on a nightly bath of sorts to keep them functioning at their best.

“It’s been coined the glymphatic system,” says A. Thomas Perkins, a sleep expert and director of the Sleep Medicine Program at Raleigh Neurology in Raleigh, North Carolina. “This system sort of flushes the brain of all metabolic waste, and it does this every night, getting in between the cells and neurons, purging the brain of the metabolic byproducts of the day.”

In 2013, a team of researchers at the Center for Translational Neuromedicine at the University of Rochester Medical Center in New York found that the brain actually makes room for this nightly flushing of cerebrospinal fluid. Space between brain cells increases during sleep, letting it essentially wash the brain of “toxic molecules.”

(more…)

Syllabi FINA-5320, FINA-1307, and FINA-4315

Syllabi Spring 2015 Dr. Friday for Finance Classes are available !


Managerial Finance 5320-W01 Professor H. Swint Friday

International Finance 4315 Professor H. Swint Friday

Personal Finance 1307 Professor H. Swint Friday

TAMU-CC Academic Calendar

December 24-January 2
Winter Break (CLOSED)
January 19
Martin Luther King, Jr. Holiday (CLOSED)
January 21
Classes begin
January 28
Last day to late register or add a class
March 16-20
Spring Break

  • Classes will not meet March 16-20.
  • The campus will be closed March 19-20.
April 10
Last day to drop a class
May 4
Last day to withdraw from the University
May 5
Last day of classes
Last day to apply for Spring (May) 2015 graduation
May 6
Reading Day
May 7-8,
May 11-13
Final examinations
May 14-15
Grading days
May 16
Spring Commencement
May 18
Deadline for faculty to submit spring grades
May 22
Faculty End Date

* Some courses will follow a different schedule. Please see the class schedule for information on when particular courses are offered.

NOTE: Dates of holidays are tentative, pending approval by The Texas A&M University System Board of Regents. For the latest information on dates and deadlines, please consult the appropriate class schedule.

Payback time

Multinationals will face rising labour costs

In 2015 the chief executives of big multinationals will worry a lot about pay: not their own, but that of their toiling staff. Rising labour costs will squeeze profit margins, which are at peak levels. Bosses will have to decide whether to resist or accommodate this pressure. Plenty, in the end, will raise their workers’ pay.

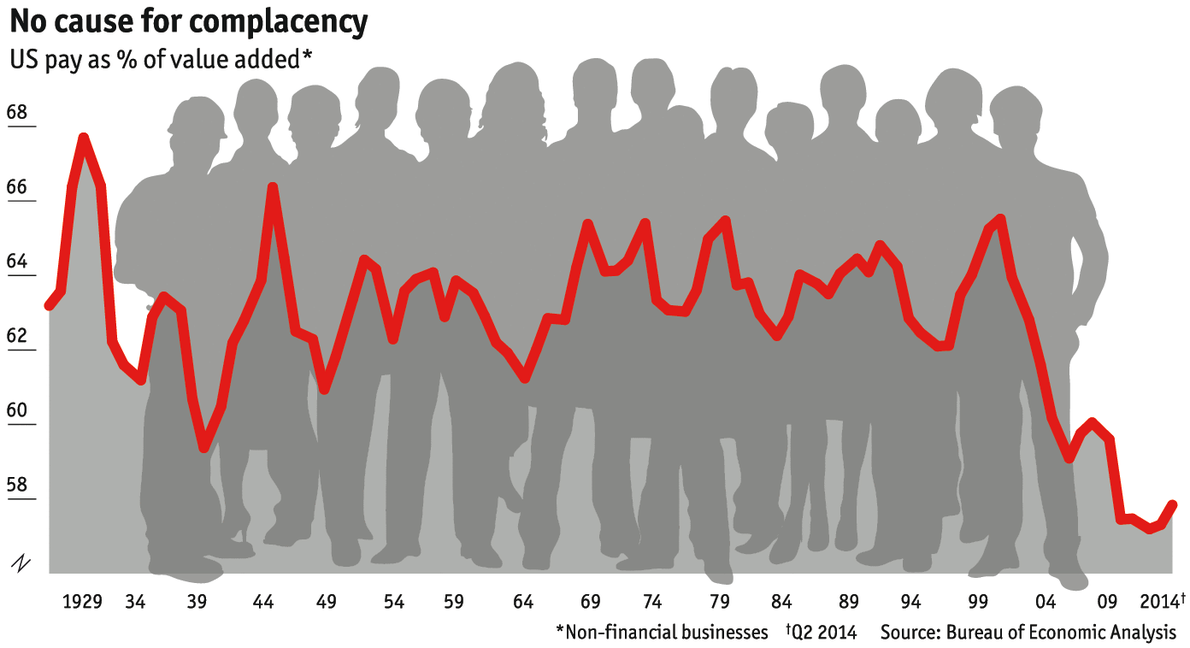
At first glance this may seem far-fetched. Since the 1990s Western firms have managed to restrain wages at home and boost efficiency. The share of value added by American non-financial firms that is spent on pay is 58%, its lowest since records began in 1929. Production has also been shifted overseas. American multinationals now have a third of their staff abroad. Per dollar of sales they are paid 40% less than their American colleagues. European firms are even more international.

(more…)