


The story behind Obama and the national debt, in 7 charts
Since President Obama took office, the national debt has increased by $7.4 trillion. On January 20, 2009, it stood at $10.6 trillion; on Monday, it was at $18 trillion. That bit of data leapt to the front page of The Drudge Report on Tuesday, linking to an assessment from CNS News.com. The increase, the site’s Terence Jeffrey writes, “is $65,443 per household, $70,985 per full-time worker and $84,266 per full-time private-sector worker.” Grim.
We thought those figures deserved some context.
These are the data on which the argument hinges. The Department of the Treasury releases daily updates on the amount of debt held by the government. There are two categories: debt held by the public, which is the sort of debt you think of when you think of government debt — Treasury bills and bonds and notes and so on — and “intragovernmental holdings,” which are securities held by other government accounts. The CNS News article didn’t adjust for 2014 dollars, which we’ve done below.
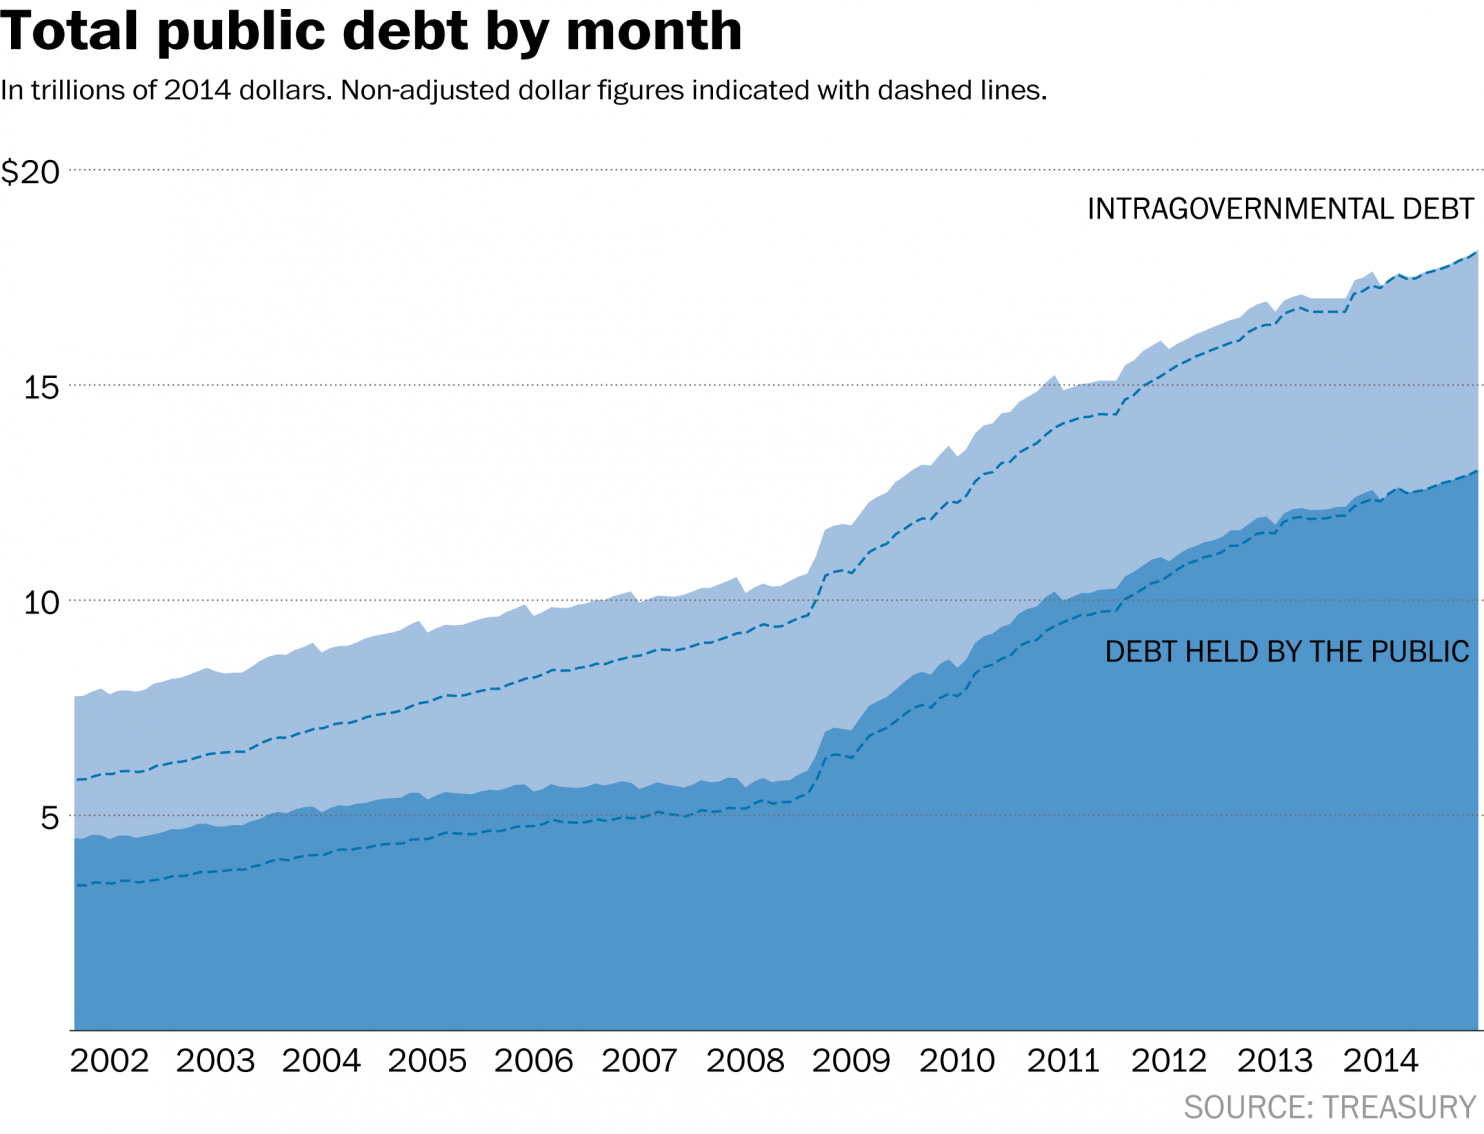
Before 2009, it was relatively flat. Then, it exploded — almost entirely in the “held by public” part of the debt.
But if you zoom in a little closer, say, from January 2008 to January 2010, you see something interesting: the fuse was lit before Obama took office. (Note that this graph is only the “held by the public” part of the debt.)
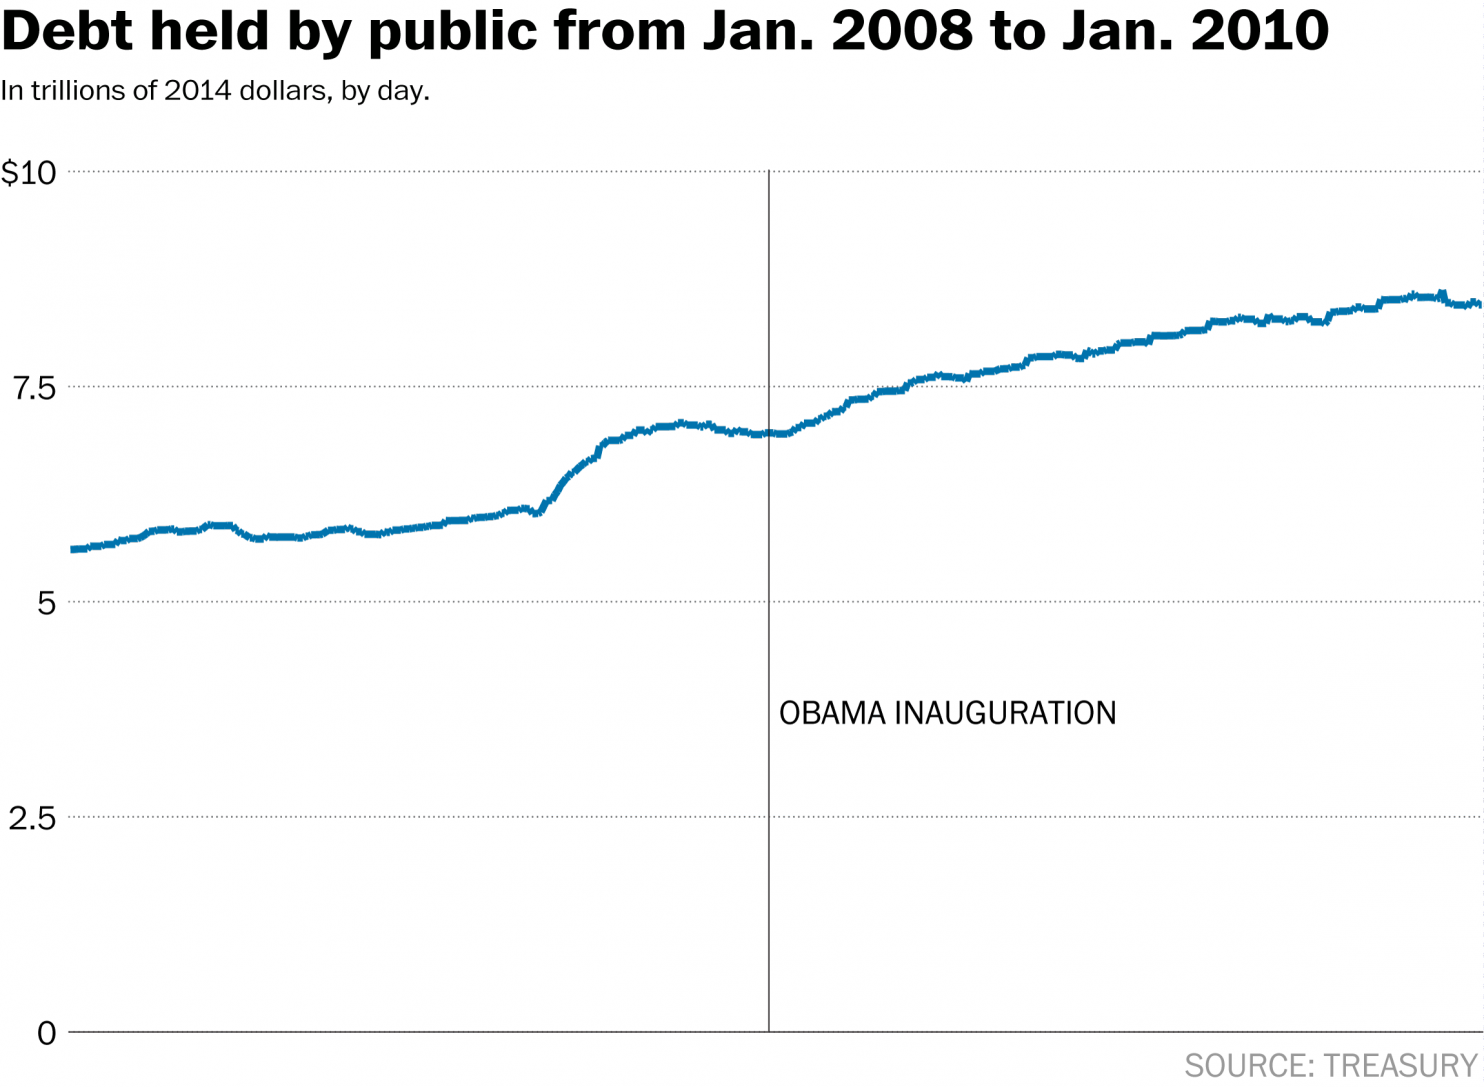
That’s because the increase in debt in the early years of the Obama administration was a largely a response to the imploding economy — just as the big bulge at the end of the George W. Bush administration (2008) was.
Debt increases are a function of the government not being able to pay its bills. Too little revenue (taxes) compared to costs (spending), and you have a deficit. Since 2002, this is what quarterly deficits (or, rarely, surpluses) have looked like.
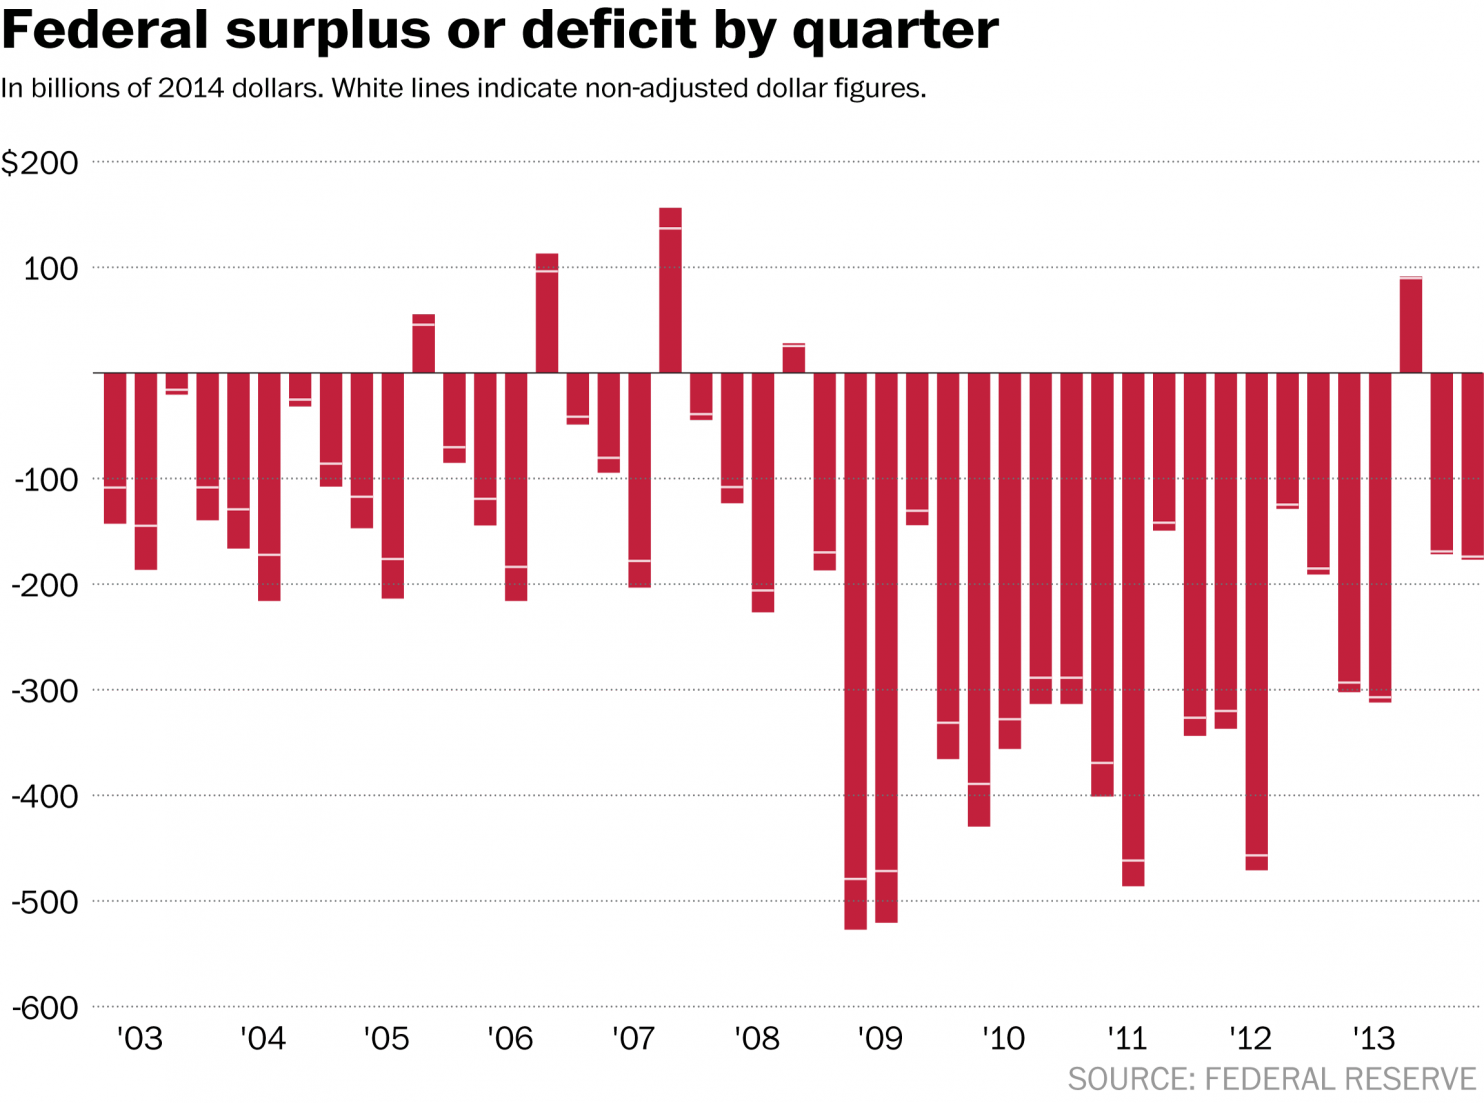
The administration likes to brag about its effort to reduce the deficit — which is fair. After all, you can see in the graph above that deficits have decreased. But the White House uses another metric: the deficit as a function of total economic production, or Gross Domestic Product (GDP). The drop is more noticeable in that comparison (especially when you look at it annually, as we do below).
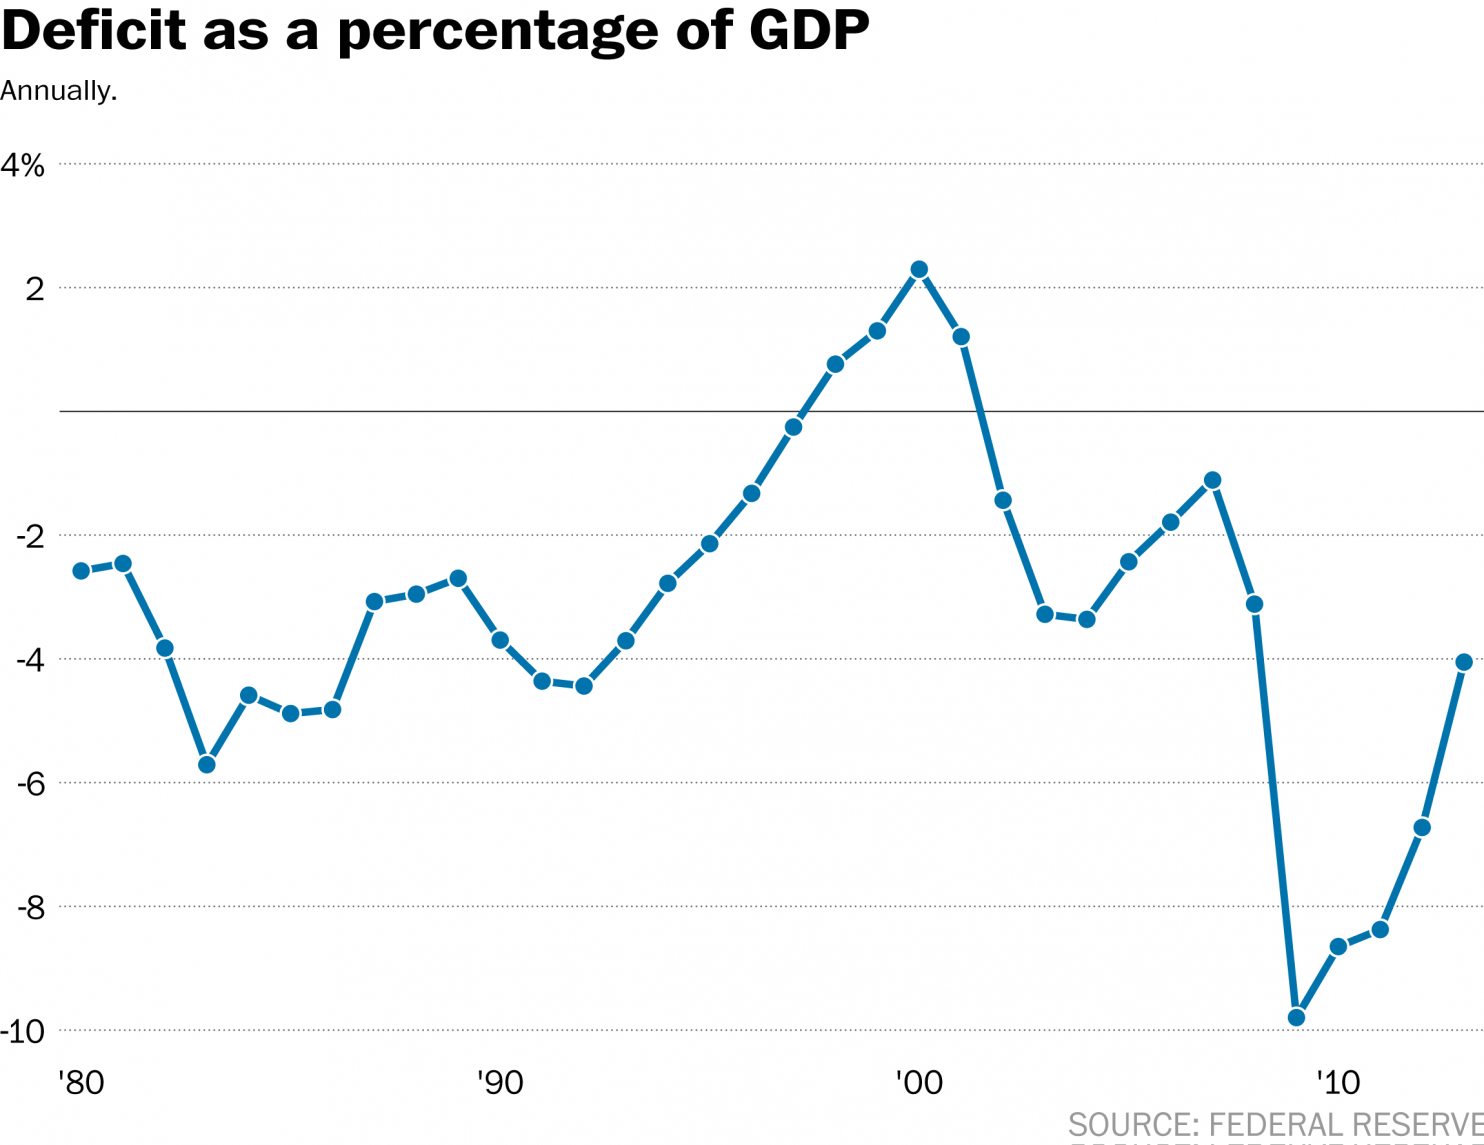
Critics of the administration, though, look at the corollary to the above chart: total debt versus GDP. And that’s a much bleaker comparison. Debt has gone from a little over 60 percent of GDP to more than 100 percent — meaning our debt is now equal to our total economic production.

So how significant an indictment of Obama is the increase in debt? We only live in this reality, of course, so we can’t tell how more or less aggressive spending under other presidents might have affected the deficit (and therefore the debt) or the economy over the past six years.
If you’re inclined to not be a fan of Obama, you’ll think this is the most compelling point. It shows the net change in the debt in trillions of dollars over the course of the last eight administrations.

But if you’re more sympathetic to the president, you’ll note this one. It shows the percent change to the debt under each president. After all, adding a few trillion dollars onto a debt that’s already a few trillion dollars in size is less of a change than if you add a few trillion dollars to almost no debt.

Obama’s term isn’t over, but it is hard to believe he could increase the debt by as large a percentage as Ronald Reagan did.
What isn’t answered in any of these graphs is the key question: To what extent does this debt matter? The answer to that is a subject of debate among economists. And to the lay person, it too tends to break along partisan lines.


