Hydraulic fracturing and horizontal drilling have made the Eagle Ford and several associated rock units one of the most prolific oil-producing targets in the United States.
Source: Geology.com

What is the Eagle Ford Shale?
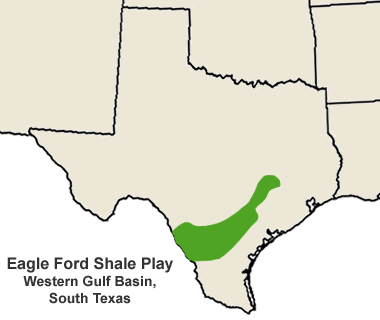
The Eagle Ford Shale (also known as the Eagle Ford Formation) is a black calcareous shale with a high organic carbon content that underlies much of southeastern Texas. In some parts of the area underlain by the Eagle Ford Shale, heat and pressure have converted organic material within the shale into oil and natural gas. Between 2008 and the present, the Eagle Ford Shale has become one of the most heavily drilled rock units in the United States. The area with active drilling is shown in green on the map in the right column of this page.
Update: Stacked Pay Zones
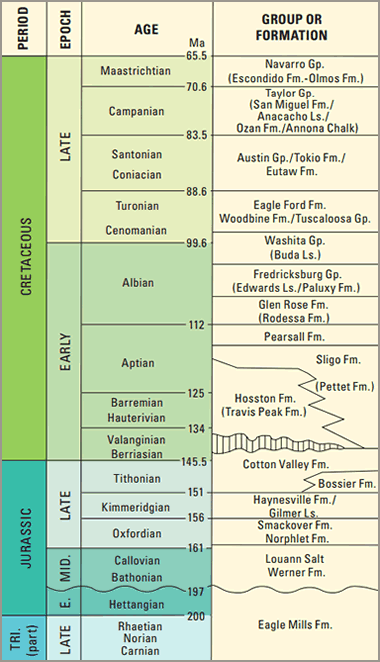
Although the Eagle Ford Shale is a relatively recent development, rock units above and below the Eagle Ford Shale have a long history of oil and gas interest. Oil and gas have been produced above the Eagle Ford from the Olmos Formation and the Austin Chalk. Below the Eagle Ford, production has been from the Buda Limestone, the Edwards Limestone and the Pearsall Shale. These rock units are shown in the stratigraphic column on the right side of this page.
Today, drillers are starting to use horizontal drilling and/or hydraulic fracturing to tap these rock units. Some recently drilled wells in the Buda Lime and Austin Chalk are producing more than 1000 barrels of oil per day.
The stacked production zones in a single location provide enormous economic savings. Oil can be produced from multiple rock units using the same drill pad, access roads and oil collection systems. All of this production concentrated in the same area also makes pipelines more profitable.
Oil and Natural Gas History
The Eagle Ford received very little attention from oil and gas companies prior to 2008. It was known to contain significant amounts of hydrocarbon and was thought to be the source rock for much of the oil and natural gas produced from rock units above it such as the Austin Chalk. However, the Eagle Ford itself was not known as an oil or natural gas producer. The rock unit had such a low permeability that oil and natural gas could not flow through the rock into a production well.
This changed in 2008 when Petrohawk drilled an Eagle Ford well in La Salle County that had an initial flow rate of 7.6 million cubic feet of natural gas per day. This well demonstrated that hydraulic fracturing and horizontal drilling could be used to produce gas from the Eagle Ford Shale. These were the same techniques used by Mitchell Energy to develop the Barnett Shale in the Fort Worth Basin.
After Petrohawk’s success, drilling companies began to use hydraulic fracturing to induce fractures in the Eagle Ford Shale at many locations. The fractures facilitate the flow of natural gas and oil out of the rock and into the well. Companies also use horizontal drilling in their development wells. With this method they drill a vertical well down to the rock unit, steer the well to horizontal and drill a “pay zone” of up to two miles in length through the high organic portion of the rock formation. The horizontal leg is then stimulated with hydraulic fracturing. This combination unlocked the potential of the Eagle Ford Shale. Wells developed with horizontal drilling and hydraulic fracturing usually yield much more oil and gas than a standard vertical well that only penetrates a few hundred feet of pay zone.
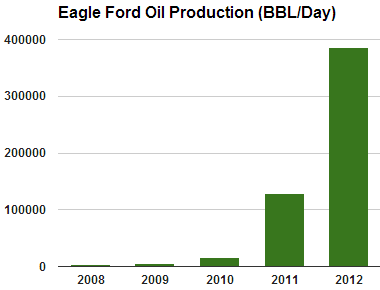
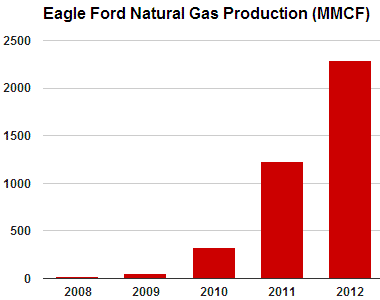
Early wells in the Eagle Ford Formation were so productive that leasing and drilling activities proceeded at a very rapid rate. This attracted an enormous amount of media attention between 2008 and 2010 as landmen were out leasing mineral rights, drilling companies were applying for permits, and oil and gas production was rising rapidly. The Eagle Ford Shale very quickly became one of the most heavily drilled rock units in the United States.
Graphs of drilling permits issued, oil production, natural gas production and condensate production can be seen below and in the right column of this page.


Petrology of the Eagle Ford Shale
As with most rocks of regional extent, the Eagle Ford Shale has a wide variety of characters. In the area where it is productive, the Eagle Ford is typically a laminated, black, calcareous, organic-rich shale with a very low permeability. This portion of the Eagle Ford is thought to have been deposited in low-energy marine waters that were far enough from shore and deep enough to avoid wave disturbance.
The black, organic-rich nature of the shale, along with its high degree of lamination suggests anoxic waters that protected the organic material from decay and the laminations from bioturbation. Its dark color is attributed to its organic content. Where its carbonate content is high the shale can be relatively brittle. This brittle nature is likely responsible for the positive response of the shale to hydraulic fracturing.
Eagle Ford Shale Structure and Thickness
The Eagle Ford Shale is Cretaceous in age. In its productive area it ranges from 50 to 400 feet thick and occurs in the Texas subsurface below the Austin Chalk and above the Buda Limestone. In other areas the Eagle Ford can be over 1000 feet thick.
Between the outcrop area and the Gulf of Mexico, the Eagle Ford Shale dips steeply into the subsurface and reaches depths of over 14,000 feet below sea level. Most of the current production is coming from areas where the Eagle Ford is between 4,000 feet below sea level and 14,000 feet below sea level. (See generalized cross section below and a structure contour map in the right column.)
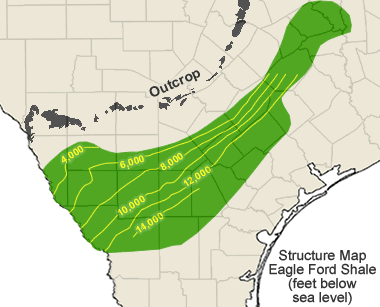
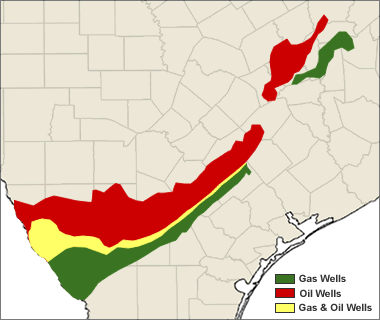
The presence of oil and natural gas production within the Eagle Ford Shale is related to burial depth. At depths of about 4000 feet, the shale has been exposed to sufficient heat and pressure to convert some of the organic material into oil. At greater depths natural gas is formed. At depths greater than about 14,000 feet, the heat and pressure are great enough to have destroyed oil and natural gas. This explains the geographic distribution of oil and natural gas production shown in the map in the right column of this page.
New Technologies are Being Developed
The Eagle Ford Shale and associated rock units have quickly become one of the most successful oil and gas areas of the United States. The technologies needed to develop production from the limestones are different from what is needed to develop the shales. These methods are being refined and should become more efficient and productive as drillers gain experience. The focus is now on the Eagle Ford but these other rock units will be there when the Eagle Ford begins to deplete or when new technologies are ready.
Contributor: Hobart King


