Home » Swint Friday’s Articles
Category Archives: Swint Friday’s Articles
Finance Careers


Americans Now Need at Least $500,000 a Year to Enter Top 1%
One definition of rich is getting into the top 1%. If that’s your goal, it’s becoming harder to reach.
The income needed to exit the bottom 99% of U.S. taxpayers hit $515,371 in 2017, according to Internal Revenue Service data released this week. That’s up 7.2% from a year earlier, even after adjusting for inflation.
Since 2011, when Occupy Wall Street protesters rallied under the slogan “We are the 99%,” the income threshold for the top 1% is up an inflation-adjusted 33%. That outpaces all other groups except for those that are even wealthier.
To join the top 0.1%, you would have needed to earn $2.4 million in 2017, an increase of 38% since 2011. The top 0.01% threshold has jumped 46%.
Meanwhile, the top 0.001% — an elite group of 1,433 taxpayers — earned at least $63.4 million each in 2017, up 51% since the Occupy protests.
(more…)Married Men Are Earning Much More Than Others in America
For men, the message is simple. If you want to get paid, get married. For women, unfortunately, working life still presents an seemingly inevitable loss of parity — at least according to new data from the St. Louis Fed.
Married men far outpaced single men and single and married women in their wages and salary through their careers, according to the report. Unmarried men and women have very little difference in income, according to the analysis of all people employed in 2016 with at least a high school diploma. But for women, getting married does little to improve wages, the St. Louis Fed study found.
Married Men Sit Atop Earnings Ladder
Source: Guillaume Vandenbroucke, St. Louis Federal Reserve
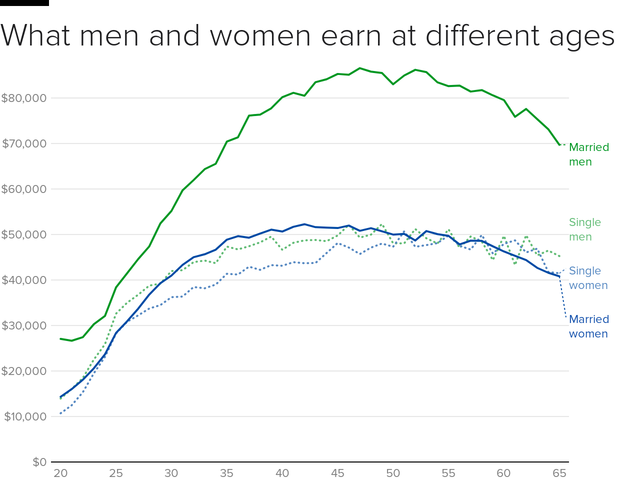
Note: Wage and salary income of workers with at least a high school diploma by age, gender, and marital status
The data doesn’t necessarily mean that being married increases a man’s wages, according to the analysis by Guillaume Vandenbroucke, a research officer at the Fed. It may mean men earning higher wages are more likely to marry and lower-income men remain single, the Fed found. Also, married and single women make similar wages, which is “not consistent with the view that the gender wage gap results from women having children earlier in life and losing ground in human capital accumulation relative to men.”
“The gender wage gap remains a complicated topic,” Vandenbroucke wrote in the summary. “But progress may come from asking different questions: not just why women earn less than men (although not compared with single men), but also why married men earn so much more than everyone else.”
By Jeff GreenWatch U.S. Oil Drilling Collapse—and Rise Again
By Tom Randall and Blacki Migliozzi
While two dozen nations are coordinating to cut oil production and rein in the global supply glut, U.S. producers are moving in the opposite direction. Over the last four months, output increased by half a million barrels a day. If that rate of expansion continues, the shale boom will break new production records by summer.
https://www.bloomberg.com/graphics/2017-oil-rigs/
After the global plunge in oil prices began in late 2014, producers began shutting drilling operations at an unprecedented rate. The number of active oil and gas rigs plummeted 80 percent to the fewest since Baker Hughes started tracking them in 1940.
The industry that’s returned has been transformed. It employs fewer workers per rig and is even more tightly focused on the rich shale formations that drove America’s oil and gas boom before the crash. Almost 90 percent of the rigs added during the rebound have been of the horizontal variety.

Wall Street’s Trick or Treat
Wall Street wants you back!
If you were one of those investors who this past spring “sold in May and went away,” you should know that the seasonal winds will soon shift and begin blowing in a bullish direction.
I’m referring, of course, to the well-known six-month-on, six-month-off seasonal pattern that goes by the name of the “Halloween Indicator.” Followers also refer to it as “Sell in May and Go Away.” In contrast to most of the alleged patterns that Wall Street claims to have discovered, this one turns out to be based on solid statistics. The stock market historically has produced the bulk of its gains in the “winter” months between Halloween and May Day.
STORY FROM HYATT
When his football career ended, he became an Opera sensation
Since the Dow Jones industrial average was created in 1896, for example, it has produced an average winter gain of 5.2%, versus just 1.7% during the summer. Not only is this difference significant at the 95% confidence level that statisticians often use to determine if a pattern is more than just a random fluke, it is not unique just to the U.S. Ben Jacobsen, a finance professor at the TIAS Business School in the Netherlands, has detected the Halloween Indicator in almost all foreign countries’ stock markets as well, and as far back as 1694 in the United Kingdom’s market.
(more…)
San Francisco is getting tiny self-driving robots that could put delivery people out of a job

A robot that looks like the love child of an icebox and R2-D2 pulls up outside a house in San Francisco. The lid pops open, uncovering a box of pastries inside.
“I got a delivery from a little roaming cooler, it looks like,” Julie O’Keefe, 67, tells the San Francisco Chronicle.
A recent test run of startup Starship Technologies’ autonomous robot shows what may be the future of on-demand delivery. The London- and Estonia-based company developed a fleet of delivery bots that aim to crack the last-mile challenge, or make the last leg of a delivery.
The startup has already begun testing in Europe, encountering more than a millionpedestrians, and plans to start tests in the Bay Area in the next couple of months.
(more…)
College student 3-D printed his own braces to save money

-

Amos Dudley’s 3-D printed braces.
He scanned and printed models of his teeth and then molded non-toxic plastic around them to form a set of 12 clear braces, Fox13Now reported. He then determined how far he needed to move each tooth to correct misalignment problems, and divided it by the maximum recommended distance a tooth should travel to determine the design for each alignment tray.
“It was very obvious which tooth [the tray] was putting pressure on,” Dudley told Fox13Now. “I was sort of worried about accumulated error, but that wasn’t the case so that was a pretty glorious moment.”
In total, he has spent 16 weeks wearing his so-called “homemade braces,” and is currently wearing the final set. He said he’s already gotten requests to print braces for others, but doesn’t want to due to liability concerns.
“I’m not interested in orthodontics,” he told Fox13Now. “It was more of a hacker project than making a business out of this.”
Black families the biggest losers under Carter and Obama Presidencies. Did best under Reagan and Clinton Presidencies.
African American Income
Black Median Household income: $33,460
(all races $50,502)
All Black Workers 2012 weekly earnings:$606
(all races $765)
Black Men weekly earnings: $633
(White men $854)
Black Women weekly earnings: $590
(White women $712)
SOURCE: 2012 3rd Quarter: Bureau of Labor Statistics – 16 Years or Older & 2011 Census Bureau American Community Survey
 During the 1990s African American income grew tremendously. By 2000, 57.9% of African American households had an annual income of $35K or more compared to just 38.2% in 1970. However due to the recession that number dropped to just 46% by 2011 reversing much of these gains. The most dramatic change during this same period is the percentage of Black households making under $15K (from 14.5% in 2000 to 25.4% in 2011) which is well below the poverty line.

Although incomes for African Americans have improved significantly since the Civil Rights era, they are still lower then the average Americans. For example the median income for Black families is $20 thousand a year less than the American median income. As you can see from the chart labeled Family Income 2010 that Black married-couple families make more than twice that of Female householder families. This charts also proves that there is a substantial benefit for those in a married-couple family regardless of race or ethnicity.
Since 2008, our national debt and deficit has ballooned jeopardizing our future.
The story behind Obama and the national debt, in 7 charts
Since President Obama took office, the national debt has increased by $7.4 trillion. On January 20, 2009, it stood at $10.6 trillion; on Monday, it was at $18 trillion. That bit of data leapt to the front page of The Drudge Report on Tuesday, linking to an assessment from CNS News.com. The increase, the site’s Terence Jeffrey writes, “is $65,443 per household, $70,985 per full-time worker and $84,266 per full-time private-sector worker.” Grim.
We thought those figures deserved some context.
These are the data on which the argument hinges. The Department of the Treasury releases daily updates on the amount of debt held by the government. There are two categories: debt held by the public, which is the sort of debt you think of when you think of government debt — Treasury bills and bonds and notes and so on — and “intragovernmental holdings,” which are securities held by other government accounts. The CNS News article didn’t adjust for 2014 dollars, which we’ve done below.
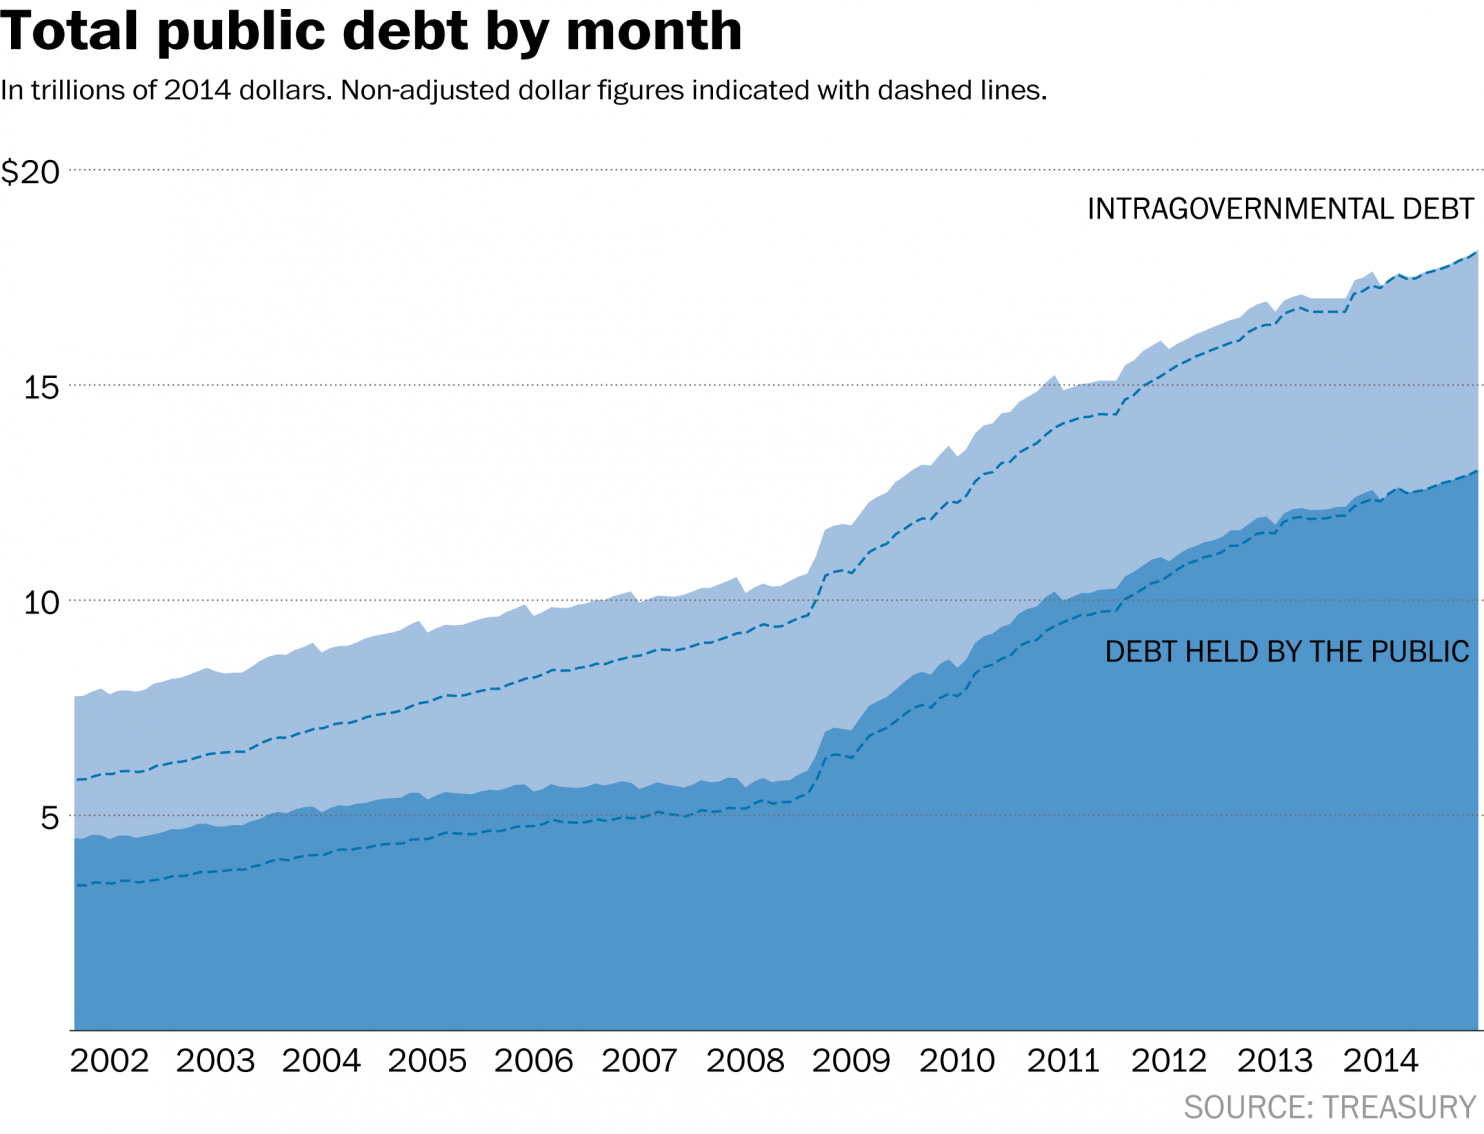
Before 2009, it was relatively flat. Then, it exploded — almost entirely in the “held by public” part of the debt.
But if you zoom in a little closer, say, from January 2008 to January 2010, you see something interesting: the fuse was lit before Obama took office. (Note that this graph is only the “held by the public” part of the debt.)
We have the worst workforce participation since Carter.
Labor Participation Rate Drops To 36 Year Low; Record 92.6 Million Americans Not In Labor Force
While by now everyone should know the answer, for those curious why the US unemployment rate just slid once more to a meager 5.9%, the lowest print since the summer of 2008, the answer is the same one we have shown every month since 2010: the collapse in the labor force participation rate, which in September slid from an already three decade low 62.8% to 62.7% – the lowest in over 36 years, matching the February 1978 lows. And while according to the Household Survey, 232,000 people found jobs, what is more disturbing is that the people not in the labor force, rose to a new record high, increasing by 315,000 to 92.6 million!
And that’s how you get a fresh cycle low in the unemployment rate.
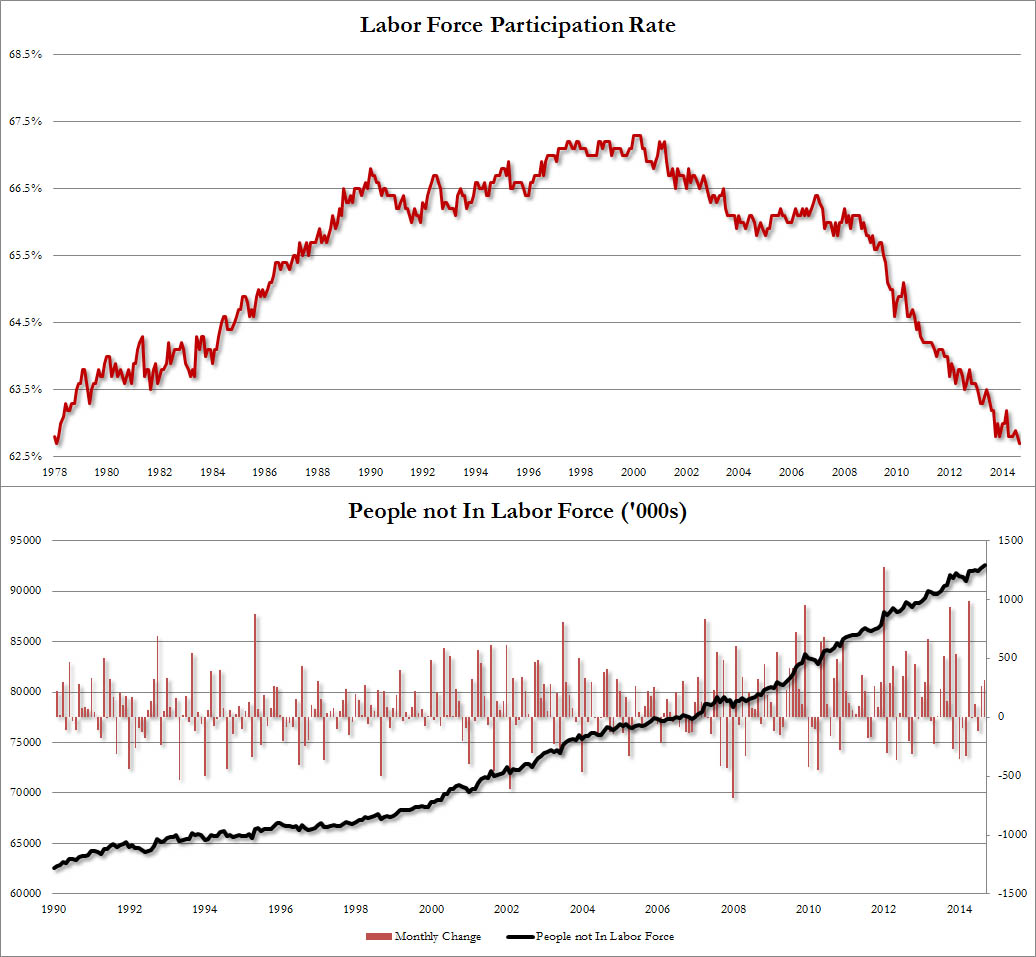
So the next time Obama asks you if you are “better off now than 6 years ago” show him this chart of employment to the overall population: it speaks louder than the president ever could.

Heightism not Sexism explains wage disparity.
Australian Economist find that height is as or more dominant than sex in wage disparity. Very simply, the taller a PERSON is the greater their pay. Men on average are 8.5% taller than women explains virtually all of the wage gap.
Read more…
$1,000 pair of Lou Boutins worth their height in inches!
Tall women’s salaries leave short girls in the shade

It may be a tall order for some women to accept.
But shorter females earn less than their loftier colleagues, a study claims
Those who stand at 5ft8in and above are twice as likely to earn more than £30,000 a year – or up to £5,000 more than their vertically challenged friends.
The researchers asked 1,461 women over the age of 16 to give details about their salary and measurements.
A fifth of those questioned who fell into the ‘tall’ category said they earned £30,000 and above compared with 10 per cent of women under 5ft8in.
At the same time, 20 per cent of the tall women said they saw their height as a source of ’empowerment and authority’ compared with just 5 per cent of shorter females.
And the study revealed that the taller you are, the more comfortable you are likely to be with your body.
A quarter of women over 5ft8in said they would not change anything about themselves.
In contrast, 90 per cent of females in the ‘short’ category said they were unhappy with their looks, the study for clothing chain Long Tall Sally found.
Arianne Cohen, author of The Tall Book: A Celebration Of Life From On High, said: ‘Research shows that tall people are consistently more successful in the workplace.
‘Not only do they earn more but they’re more likely to be in leadership positions.
‘As taller people have a downward eyecast when speaking to shorter colleagues, they are instinctively perceived to have authority and confidence.
‘It means that those who are taller are respected by their colleagues and bosses, giving them a thriving atmosphere that leads them to more success.’
The 24/7 Work Culture’s Toll on Families and Gender Equality
The biggest obstacle to women in joining the highest ranks of the business world is a lack of family-friendly policies. That, at least, has been the conventional wisdom in recent years, and it has been embraced by progressive companies that offer flexible schedules or allow people to work from home.
But some researchers are now arguing that the real problem is not the lack of family-friendly policies for mothers, but the surge in hours worked by both women and men. And companies are not likely to want to adopt the obvious solution.
The pressure of a round-the-clock work culture — in which people are expected to answer emails at 11 p.m. and take cellphone calls on Sunday morning — is particularly acute in highly skilled, highly paid professional services jobs like law, finance, consulting and accounting.
Offering family-friendly policies is too narrow a solution to the problem, recent research argues, and can have unintended consequences. When women cut back at work to cope with long hours, they end up stunting their careers. And men aren’t necessarily happy to be expected to work extreme hours, either.

“These 24/7 work cultures lock gender inequality in place, because the work-family balance problem is recognized as primarily a woman’s problem,” said Robin Ely, a professor at Harvard Business School who was a co-author of a recent study on the topic. “The very well-intentioned answer is to give women benefits, but it actually derails women’s careers. The culture of overwork affects everybody.”
The Public Pension Funding Trap
To make up for shortfalls in contributions, plans take extraordinary risks to earn higher returns.
By ANDREW G. BIGGS
May 31, 2015 5:56 p.m. ET
State and local government pensions were national news during the recession, as unfunded liabilities rose into the trillions of dollars and overheated commentators predicted that rising pension costs could push governments into bankruptcy. Today attention has faded and the public-pension industry claims that plans are back on track. Don’t be too sure.
Governments are still failing to make their full contributions; as recently as this week New Jersey’s chief budget analyst deemed it not “fiscally or physically possible” for the state to make its nearly $3 billion full pension contribution this year. Public pensions are taking greater investment risk with the money they do receive. If those investments fail to pan out, the budget picture for many governments will once again be grim.
Thanks to rising stock markets, the average pension funding ratio, which compares a plan’s assets to its benefit liabilities, rose to 76% from 72% in 2014, according to the Public Plans Database. This led the National Conference on Public Employee Retirement Systems to crow in December that “the vast majority of public pensions are well funded and are growing stronger as the economy continues to recover.” More recently the National Association of State Retirement Administrators statedthat “most states have made a reasonably good effort” to fund their plans. The “perception that many plans and states have failed” is wrong; funding problems persist, Nasra said, in “only a handful of states.”